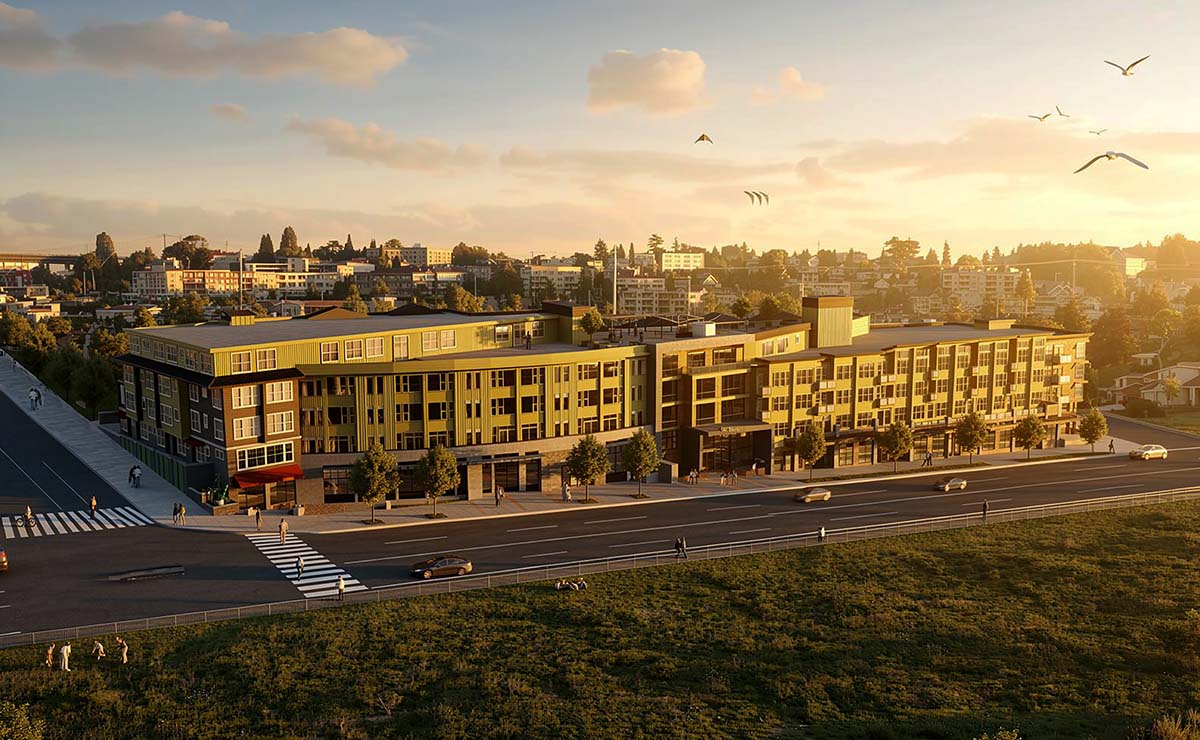
Prescott Wallingford Apartments
Urban Infill Residential Visualization for a Transitional Seattle Corridor
Opening Reality — Infill Projects Are About Perception Shift
Urban infill development is not just about replacing buildings. It is about redefining how a site is perceived. Visualization plays a critical role in helping stakeholders understand how increased density can integrate into an existing neighborhood.
Project Overview
Prescott Wallingford is a mixed-use residential development located at 3920 Stone Way North in Seattle, replacing an underutilized commercial site with a modern multifamily building.
The project consists of:
- Approximately 150+ residential units
- Total building size of approximately 100,000+ square feet
- Unit mix including studios, one-bedroom, one-bedroom with den, and two-bedroom units
- Unit sizes ranging from approximately 450 to 780+ square feet
- Ground-level retail and live/work activation
- Structured parking and residential amenities
Community amenities include a rooftop deck, fitness center, resident lounge, and secure parking and bike storage.
Our role focused on producing renderings that communicated the transformation of the site and its integration into the surrounding neighborhood.
The Real Challenge — Density Without Disruption
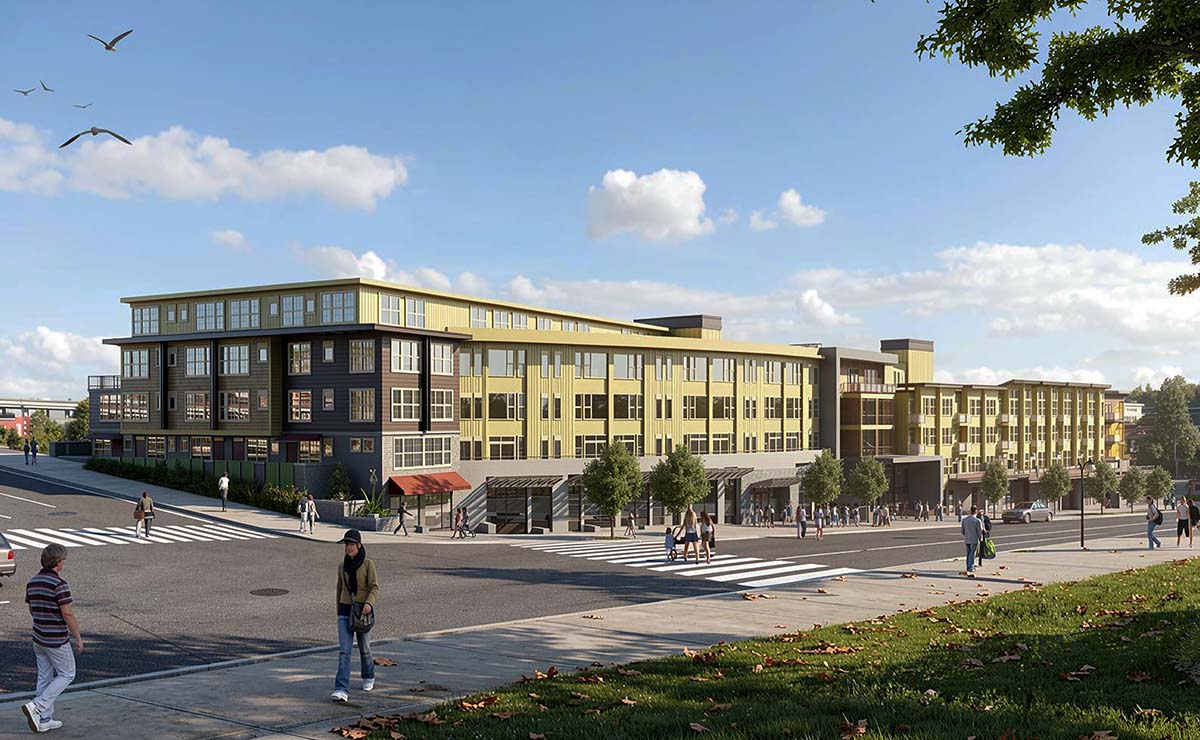
The project needed to demonstrate that increased density could activate the street edge, support retail and pedestrian use, fit within the scale of the neighborhood, and improve the overall urban environment.
Visualization Strategy — Street-Level First
The renderings emphasized active retail frontage, pedestrian interaction, entry points, and integration with surrounding buildings. This helps shift perception from new development to natural evolution.
Program Clarity — What the Project Delivers
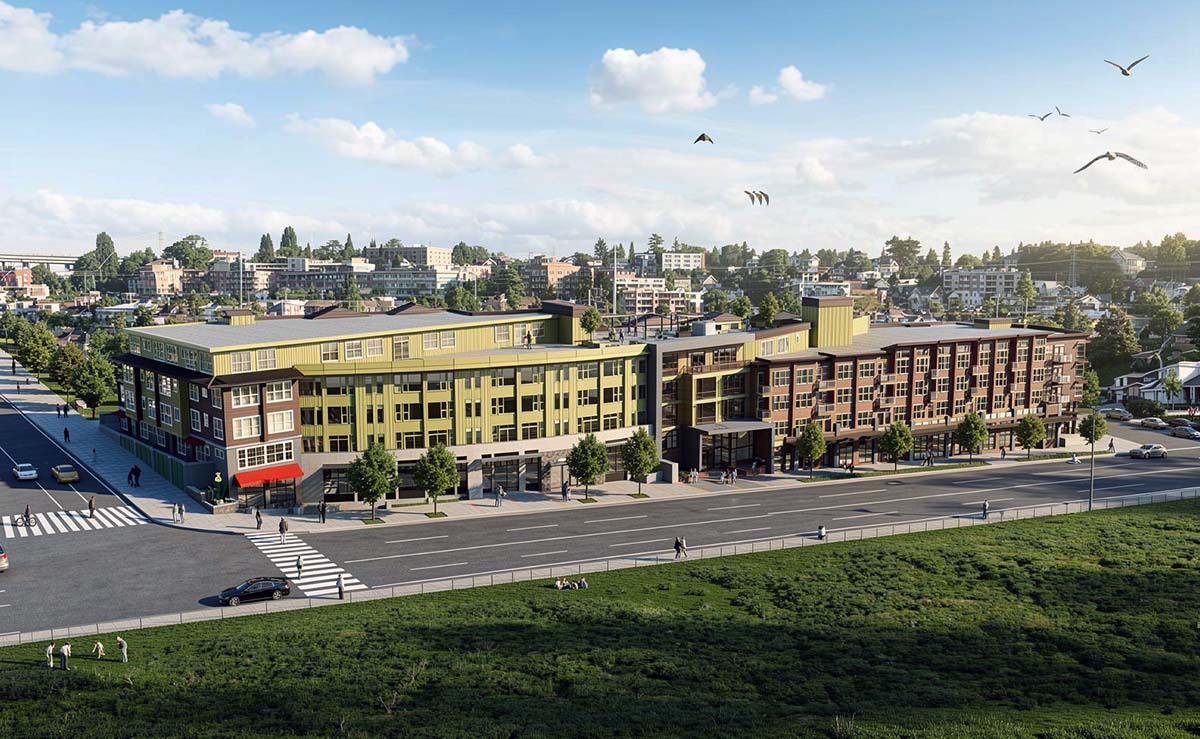
The visualization supports understanding of the project as a mid-rise multifamily development with 150+ units, mixed-use ground floor, and a walkable urban location supporting neighborhood growth.
What This Allowed the Client to Do
The renderings supported stakeholder communication, market positioning, and a clear understanding of the site transformation prior to completion.
What This Project Shows
This case demonstrates how visualization helps communicate change in urban environments and supports the transition of underutilized sites into productive, integrated developments.
CAHDD Transparency — How These Images Were Created
Most of our work is CAHDD Stage 0 or Stage 1. That means it is either fully human-created or built using standard digital tools with complete human control. That is still the foundation of how we work.
For some of the images in this case study, we pushed into CAHDD Stage 3. These were run through an AI-based enhancement process to improve resolution, color, and lighting. The design, modeling, composition, and intent are all ours, but the AI is participating in the refinement. Because of that, we are calling it what it is.
This is not a replacement for how we work. It is a controlled use of a tool. We are testing it, understanding it, and being upfront about it.
CAHDD (Computer Aided Human Designed & Developed) is a framework we created to make this kind of transparency simple and visible. It is not about enforcement or gatekeeping. It is about showing where the human hand is and where the machine starts to get involved.
CAHDD Stages as they apply to architectural visualization:
Stage 0 — Fully hand-created work with no digital tools.
Stage 1 — Standard digital workflow. Modeling, rendering, and post-production with full human control.
Stage 2 — Procedural or automated processes that assist, but do not influence creative decisions.
Stage 3 — Human-directed work with AI assisting in refinement such as lighting, resolution, or visual polish.
Stage 4 — AI-generated content with human direction and selection.
Stage 5 — Fully AI-generated work with minimal human input.
Stage X — Mixed or evolving workflows that combine multiple stages.
Full framework and philosophy: CAHDD.org